
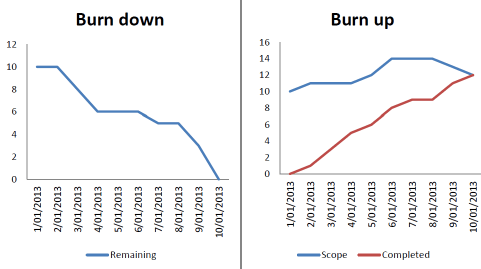
“Burn up” and “burn down” charts are two common types of project management tools used in Agile methodologies to track and visualize the progress of tasks or work items within a project. These charts help project teams understand how work is progressing and whether they are on track to meet their goals.
- Burn Up Chart:
- A burn-up chart is used to track the cumulative progress of work items over time.
- The x-axis represents time (usually in iterations or sprints), while the y-axis represents the amount of work completed.
- As work items are completed, they are added to the chart, showing the total amount of work done at any given point in time.
- The chart typically includes two lines: one showing the actual work completed, and another showing the scope or total work that was initially planned.
- The gap between the two lines can help the team assess whether they are on track to complete all planned work within the time frame.
- Burn Down Chart:
- A burn-down chart, on the other hand, is used to track the remaining work over time.
- The x-axis represents time (usually in iterations or sprints), while the y-axis represents the amount of work remaining.
- Initially, the chart shows the total planned work, and as work items are completed, the line representing remaining work should trend downwards.
- The goal of a burn-down chart is to ensure that the remaining work is gradually decreasing, indicating progress toward project completion.
- Deviations from the expected burn-down line can help the team identify issues or changes in scope.
Both burn-up and burn-down charts provide visual representations of project progress, helping teams identify trends, make informed decisions, and adapt their plans as needed during the project’s lifecycle. These charts are commonly used in Agile methodologies like Scrum and Kanban to promote transparency and facilitate effective communication within the team and with stakeholders.